Largest-ever exploration programs unlock new growth frontiers at its highly prospective Mexican assets
Coeur Mining, Inc. (“Coeur& or the “Company&) (NYSE, TSX: CDE) today provided an update on its extensive exploration activities at the Palmarejo and Las Chispas gold-silver operations in Mexico.
This press release features multimedia. View the full release here: https://www.businesswire.comews/home/20260721819271/en/
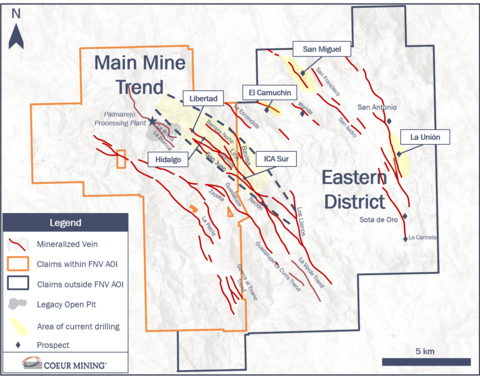
Figure 1. Map of Palmarejo Main Mine Trend and Eastern District showing major vein trends
Coeur&s $158 million investment in exploration programs in 2026 is twice last year&s level and represents the largest program ever undertaken by Coeur. It includes planned investments of $27 million and 83 kilometers of drilling at Palmarejo and $24 million and 119 kilometers of drilling at Las Chispas. Over the past five years, Coeur has invested approximately $340 million in exploration, which has contributed to meaningful mine life extension and reserves and resources growth across the portfolio.
At Palmarejo, the exploration program continues to focus on accelerating Eastern District resource growth and building resources along the Main Mine Trend (see Figures 1, 2 and 3). Drilling at San Miguel and La UniĂłn in the Eastern District continues to deliver wide, high-grade intercepts, and materially extend the deposits, which remain open in all directions. Coeur is initiating internal development studies as the Eastern District continues to emerge as a potential source of long-term production. Drilling along the Main Mine Trend has further expanded mineralization at both the Hidalgo Corridor and Independencia Sur, where results are expected to add near-term reserves located both within and outside of the Franco-Nevada gold stream boundaries.
Continued drilling success is expected to drive further resource growth alongside the evaluation of future development opportunities. Intercept highlights include (true widths)1,2,3:
- San Miguel
- SMDH-138: 11.5 m at 6.9 grams per tonne (“g/t&) gold and 1,250 g/t silver
- SMDH-118: 10.8 m at 3.4 g/t gold and 1,083 g/t silver
- SMDH-125: 25.7 m at 3.3 g/t gold and 20 g/t silver
- La UniĂłn
- LUDH-111: 14.5 m at 6.3 g/t gold and 19 g/t silver
- LUDH-093: 7.9 m at 7.0 g/t gold and 14 g/t silver
- LUDH-096: 6.3 m at 7.5 g/t gold and 16 g/t silver
- Hidalgo
- HGDH-229 (Hidalgo): 2.2 m at 29.5 g/t gold and 954 g/t silver
- HGDH-226 (Libertad): 1.9 m at 25.7 g/t gold and 1,316 g/t silver
- HGDH-227 (San Juan): 8.7 m at 3.5 g/t gold and 252 g/t silver
- Independencia Sur
- VIDH-221: 9.1 m at 16.5 g/t gold and 206 g/t silver
- VIDH-222: 9.9 m at 2.4 g/t gold and 339 g/t silver
- VIDH-225: 9.2 m at 2.4 g/t gold and 271 g/t silver
At Las Chispas, key priorities for 2026 include expansion of new discoveries made last year to build near-term resource growth and sustained scout drilling to replenish the inferred pipeline. An accelerated drilling program is advancing across the Gap Zone, Las Chispas, and Chiltepines blocks (see Figure 4). Continued drilling success has resulted in the discovery of multiple new vein splays while also expanding several key veins more than one kilometer in strike length, prompting more aggressive infill drilling and resource conversion. Recent results continue to highlight the Gap Zone as a potential source of significant resource growth with Augusta and La Promesa, which were both discovered in 2025 and included in year-end 2025 reserves, demonstrating the rapid discovery-to-reserve conversion pathway at Las Chispas. Recent intercept highlights include (true widths):
- Augusta
- AUGEXP-26-005: 0.8 m at 23.0 g/t gold and 5,948 g/t silver
- AUGII-25-021: 0.3 m at 20.5 g/t gold and 3,563 g/t silver
- Promesa:
- AUGEXP-26-005: 0.3 m at 68.4 g/t gold and 9,199 g/t silver, including 0.1 m at 156.0 g/t gold and 20,990 g/t silver
“This update showcases the strength of Coeur&s exploration portfolio and the exceptional work being delivered by our teams across Mexico,& said Aoife McGrath, Executive Vice President, Exploration. “At Palmarejo, continued success in the Eastern District is demonstrating the potential for a significant new growth platform, while at Las Chispas, recent drilling success continues to support one of the fastest discovery-to-reserve conversion cycles in our portfolio, with exceptional grades and strong vein continuity. The scale of our 2026 programs reflects our confidence in these assets and our commitment to creating long-term value through disciplined exploration, resource growth, and the pursuit of the next generation of mine life extensions and development opportunities. Focused exploration in and around our existing operations is a critical element of Coeur&s capital allocation strategy and a key component of driving higher returns on invested capital within the portfolio.&
Palmarejo
At Palmarejo, exploration in the Eastern District has remained a focus, with the 2024 acquisition of the Fresnillo mineral claims allowing for consolidation and unencumbered exploration in the area. Recent results support the potential of the Eastern District to become a significant new mining front at Palmarejo, both in the medium-term near the Main Mine Trend (Independencia Sur), and longer-term at San Miguel and La UniĂłn (see Figures 1 and 2).
Following the addition of the maiden resources in 2025, San Miguel and La UniĂłn now comprise more than 20% of Palmarejo&s total mineral inventory with both deposits open in each direction. In 2026, approximately 70% of the exploration budget at Palmarejo is being allocated to the Eastern District.
San Miguel remains one of Palmarejo's most important discovery areas, forming part of a broader 9-kilometer mineralized corridor that extends southeast through San Isidro to Sota de Oro (see Figure 2), with only 5% of the trend drill-tested to date. La UniĂłn forms part of a more than 8-kilometer mineralized corridor that includes several additional prospects, including Veronica, San Antonio, San JosĂ© and Carmela (see Figure 2). These targets and others across the Eastern District remain largely undrilled and systematic testing is planned to commence later this year. At the recently discovered CamuchĂn target (see Figure 2), drilling to date has delineated mineralization over more than one kilometer of strike length, while mapping has identified additional priority targets, including Wanda, a new trend located approximately 900 meters southwest of, and parallel to, San Miguel.
San Miguel, La UniĂłn and other priority targets demonstrate the scale and diversity of mineralization across the Eastern District and reinforce the broader exploration opportunity and growth potential of the region. Work at San Miguel underscores its potential as a high-grade, silver-rich epithermal vein system with strong continuity along strike and at depth, while La UniĂłn represents a potential broader, gold-rich system characterized by stockwork veining and brecciation within a large structural corridor.
Main Mine Trend: Continued growth along the Hidalgo Corridor
Hidalgo, Palmarejo's second-largest reserve after the Guadalupe deposit, which has been a key source of production since 2015, continues to emerge as a key source of near-mine growth and remains open towards the northwest. Drilling along the Hidalgo, Libertad and San Juan vein trends has added 5.8 kilometers of strike length since the initial discovery of the Hidalgo vein in 2019, including 200 meters so far in 2026. Recent results continue to demonstrate robust grades and widths across the trend, while initial review of two scout holes drilled 600 meters northwest of Libertad (assays pending - see Figure 3) show indications that the corridor may extend further. One kilometer of additional potential strike length to the northwest is expected to be tested in 2027.
Independencia Sur
Independencia Sur, the southeastern extension of the producing Independencia deposit (see Figures 1 and 3), represents a near-term growth opportunity located outside of the Franco-Nevada stream boundary. Drilling commenced on this property in 2024 after Coeur&s acquisition of the Fresnillo mineral claims. Recent infill and expansion drilling in the northwestern portion of the trend, which is closest to existing infrastructure, has defined three mineralized veins over approximately 950 meters of strike and 300 meters of vertical extent within a broader 1.8-kilometer structural corridor. Encouraging grades, widths and continuity support the potential for near-term reserve conversion.
Las Chispas
Gap Zone Emerges as a Key Growth Corridor
The previously underexplored Gap Zone between the Babicanora and Las Chispas Blocks continues to emerge as a key growth corridor at Las Chispas (see Figure 4). Recent success in discovering and expanding veins within the Gap Zone has indicated potential continuity between the previously separate Babicanora Block and Las Chispas Block vein domains, while drilling at Augusta, La Promesa, William Tell and North Las Chispas has expanded multiple veins laterally and at depth, with several now exceeding one kilometer in strike length.
Building on the discovery of the Augusta Vein System (see Figure 4), an accelerated program of expansion drilling that commenced in 2025 has successfully grown several veins to over one kilometer in strike, with multiple associated veins and splays discovered. Augusta contributed to year-end 2025 reserves within 12 months of discovery, underscoring the district's rapid discovery-to-reserve conversion pathway. The system now comprises eight veins and splays with an approximate combined 4.2 kilometers of strike length and remains open along strike and at depth. Additional result highlights include (true widths):
- North Las Chispas (NLC) has continued to deliver some of the highest-grade intercepts drilled on the property to date, including LCHII-25-020: 1.6 m at 38.4 g/t gold and 7,982 g/t silver, including 0.3 m at 143.0 g/t gold and 36,190 g/t silver
- Los Sheiks has demonstrated significant growth potential, with drill results confirming high-grade mineralization over 440 meters (an increase of 300 meters since 2025) and indicating possible southward continuity with Augusta (see Figure 4), which, if verified, would create the longest new vein system discovered outside the Babicanora Block. Highlight intercepts include:
- LS-26-028: 0.4 m at 22.6 g/t gold and 2,035 g/t silver
- LS-26-026: 0.9 m at 3.9 g/t gold and 524 g/t silver
- The recent discovery of the high-grade La Promesa vein, located between the Augusta and William Tell veins, further demonstrates the strong discovery potential in the Gap Zone and between known veins, an occurrence that is common across the broader district. The system has now been traced for up to 470 meters along strike and 220 meters vertically and remains open to the southeast
In 2026, exploration at Palmarejo and Las Chispas is expected to exceed 200,000 meters of scout, expansion, and infill drilling, underscoring Coeur&s continued commitment to disciplined brownfields exploration to generate new discoveries, expand known mineralized systems, and support long-term mine life extension opportunities.
For a complete table of all drill results, please refer to the following link: https://s201.q4cdn.com/254090064/files/doc_downloads/2026/07/Las-Chispas-and-Palmarejo-Exploration-Drilling-Update.pdf. Please see the “Cautionary Statements& section for additional information regarding drill results.
About Coeur
Coeur Mining, Inc. is a U.S.-based, well-diversified, growing precious metals producer with seven wholly-owned operations: the New Afton gold-copper mine in British Columbia, Canada, the Rainy River gold-silver mine in Ontario, Canada, the Las Chispas silver-gold mine in Sonora, Mexico, the Palmarejo gold-silver mine in Chihuahua, Mexico, the Rochester silver-gold mine in Nevada, the Kensington gold mine in Alaska and the Wharf gold mine in South Dakota. In addition, the Company wholly-owns the Silvertip polymetallic critical minerals exploration project in British Columbia, Canada.
Cautionary Statements
This news release contains forward-looking statements within the meaning of securities legislation in the United States and Canada, including statements regarding mineral reserve and mineral resource estimates, exploration efforts and plans, growth, mine lives, mine expansion and development plans, and resource delineation, expansion, and upgrade or conversion. Such forward-looking statements involve known and unknown risks, uncertainties, and other factors that may cause Coeur&s actual results, performance, or achievements to be materially different from any future results, performance, or achievements expressed or implied by the forward-looking statements. Such factors include, among others, the risk that anticipated additions or upgrades to reserves and resources are not attained, the risk that planned exploration programs may be curtailed or canceled due to budget constraints or other reasons, the risks and hazards inherent in the mining business (including risks inherent in developing large-scale mining projects, environmental hazards, industrial accidents, weather or geologically related conditions), changes in the market prices of gold and silver, and a sustained lower price environment, the uncertainties inherent in Coeur&s production, exploratory, and developmental activities, including risks relating to permitting and regulatory delays, ground conditions, grade and recovery variability, any future labor disputes or work stoppages, the uncertainties inherent in the estimation of mineral reserves and mineral resources, the potential effects of pandemics or epidemics, including impacts to the availability of our workforce, continued access to financing sources, government orders that may require temporary suspension of operations at one or more of our sites and effects on our suppliers or the refiners and smelters to whom the Company markets its production, changes that could result from Coeur&s future acquisition of new mining properties or businesses, the loss of any third-party smelter to which Coeur markets its production, the effects of environmental and other governmental regulations, the risks inherent in the ownership or operation of or investment in mining properties or businesses in foreign countries, Coeur&s ability to raise additional financing necessary to conduct its business, make payments, or refinance its debt, as well as other uncertainties and risk factors set out in filings made from time to time with the United States Securities and Exchange Commission and the Canadian securities regulators, including, without limitation, Coeur&s most recent reports on Form 10-K and Form 10-Q. Actual results, developments, and timetables could vary significantly from the estimates presented. Readers are cautioned not to put undue reliance on forward-looking statements. Coeur disclaims any intent or obligation to update publicly such forward-looking statements, whether as a result of new information, future events, or otherwise. Additionally, Coeur undertakes no obligation to comment on analyses, expectations, or statements made by third parties in respect of Coeur, its financial or operating results, or its securities.
The scientific and technical information concerning our mineral projects in this news release has been reviewed and approved by a “qualified person& under Item 1300 of Regulation S-K under the Securities Exchange Act of 1934, as amended (“SK 1300&), namely our Senior Vice President, Technical Services, Christopher Pascoe. For a description of the key assumptions, parameters, and methods used to estimate mineral reserves and mineral resources for Coeur&s material properties included in this news release, as well as data verification procedures and a general discussion of the extent to which the estimates may be affected by any known environmental, permitting, legal, title, taxation, sociopolitical, marketing, or other relevant factors, please review the Technical Report Summaries for each of the Company&s material properties, which are available at www.sec.gov.
Notes
The ranges of potential tonnage and grade (or quality) of the exploration results described in this news release are conceptual in nature. There has been insufficient exploratory work to define a mineral resource, and it is uncertain if further exploration will result in the estimation of a mineral resource. The exploration results described in this news release therefore do not represent, and should not be construed to be, an estimate of a mineral resource or mineral reserve.
- For a complete table of all drill results included in this release, please refer to the following link: https://s201.q4cdn.com/254090064/files/doc_downloads/2026/07/Las-Chispas-and-Palmarejo-Exploration-Drilling-Update.pdf.
- Rounding of grades, to significant figures, may result in apparent differences.
- All drill intervals are estimated true widths.
View source version on businesswire.com: https://www.businesswire.comews/home/20260721819271/en/