Vancouver, British Columbia--(Newsfile Corp. - July 15, 2026) - Founders Metals Inc. (TSXV: FDR) (OTCQX: FDMIF) (FSE: 9DL0) ("Founders" or the "Company") announces surface exploration and drilling results from its fully funded 70,000-metre drill program at the Antino Gold Project ("Antino" or the "Project") in southeastern Suriname (Figure 1). In the first half of 2026 Founders has advanced multiple gold systems simultaneously - this release highlights a new discovery at Antino Northeast, continued growth at Antino North and Maria Geralda, and an exciting follow-up drill hole at Antino West.
Highlights
Antino Northeast
-
First-ever drilling confirms a new gold discovery on a kilometre-scale gold-in-auger anomaly with 1,200 m drill-confirmed strike length (Figure 1)
-
58.5 metres (m) of 1.00 grams per tonne (g/t) gold (Au) from 18.6 m (ANE009), including 18.0 m of 1.59 g/t Au
-
53.0 m of 0.46 g/t Au from 149.0 m (ANE002), including 8.0 m of 2.29 g/t Au
-
Antino North
-
Drilling has now tested and confirmed mineralization along three of twelve mapped northwest-trending parallel shear zones; nine shears remain untested (Figure 1)
-
16.5 m of 1.82 g/t Au from 8.1 m, including 3.0 m of 6.38 g/t Au (AN002), 8.1 m of 3.42 g/t Au from surface (AN009), and 22.5 m of 0.46 g/t Au from 32.1 m (AN005)
-
Maria Geralda
-
Fifteen new deep auger holes expand the high-grade gold previously defined, with near-surface intercepts including (Figure 2):
-
30.0 m of 4.52 g/t Au (MGAD061), 23.0 m of 5.31 g/t Au (MGAD062), 19.0 m of 4.02 g/t Au (MGAD064), 9.0 m of 6.24 g/t Au (MGAD074), 30.0 m of 3.69 g/t Au (MGAD060), and 17.0 m of 2.94 g/t Au (MGAD063)
-
-
In several holes, mineralization continues to the 30 m auger limit. The Company has a diamond drill moving to Maria Geralda in early August to test these results in bedrock.
Antino West
-
A 35-metre-wide shear zone with visible gold intersected in drill hole FR251 at Antino West, 50 m along strike from the previously released discovery hole (FR217: 53.1 m of 1.21 g/t Au); assays pending (Figure 3)
Colin Padget, President & CEO, commented, "Our exploration strategy continues to deliver, and we are thrilled to keep making new gold discoveries across Antino - this time at Antino Northeast, where drilling returned 58.5 metres of 1.00 g/t gold. This comes as we continue to expand the Antino North discovery, now with mineralization across three parallel structures and to 200 metres of vertical depth, and as deep auger drilling grows the high-grade, near-surface gold footprint at Maria Geralda. At Antino West, follow-up drilling has intersected a 35-metre-wide shear zone with visible gold in core, 50 metres away from the initial discovery, with assays pending. With multiple discovery fronts advancing at once and a fully funded 70,000-metre drill program underway, we believe we are only beginning to unlock the district-scale potential of Antino."
Geological Discussion
Antino Northeast
At Antino Northeast, the Company completed its first-ever drilling, testing a kilometre-scale gold-in-auger anomaly - one of the largest geochemical anomalies identified anywhere on the Antino land package. Discovery hole ANE009 returned 58.5 m of 1.00 g/t Au from 18.6 m, confirming a new mineralized gold system within the anomaly. Approximately 1,200 m away, hole ANE002 intersected 53.0 m of 0.46 g/t Au from 149.0 m, further demonstrating the scale of the system (Figure 1). Mineralization remains open in all directions, and the majority of the auger anomaly has yet to be drill-tested. Follow-up drilling is planned to further define the extent of the gold system and test a second major parallel structure identified with structural mapping as well as surficial auger sampling programs.
Antino North
The Antino North discovery, first announced in April 2026, is a series of northwest-trending, shear-hosted gold zones mapped over multiple kilometres across the area. To date, the Company's surface program has identified twelve parallel shear structures, of which three have now been drill-tested. Mineralization is similar in character to the shear- and vein-hosted gold at Upper Antino, comprising sheared subvertical quartz veins with a sericite-ankerite-tourmaline alteration assemblage and late brittle deformation overprinting. The mapped shear zones are spatially coincident with a large regional-scale fold - a structural setting commonly associated with orogenic gold deposits across the Guiana Shield. Results include 16.5 m of 1.82 g/t Au from 8.1 m (AN002), 8.1 m of 3.42 g/t Au from surface (AN009), 10.0 m of 0.87 g/t Au from 209.0 m (AN004), and 22.5 m of 0.46 g/t Au from 32.1 m (AN005) (Figure 1).
Maria Geralda Deep Auger
Building on the deep auger program reported in May 2026, which defined a coherent, plunging high-grade gold shoot at Maria Geralda, the Company has completed fifteen additional deep auger holes. Five of the new holes were drilled on the same 3 m x 3 m vertical grid to 30 m depth in saprolite, with nine along a new drill fence stepping out 9 m to the north, and one 18 m to the north. Results from these holes include 9.0 m of 6.24 g/t Au (MGAD074) and 28.0 m of 0.85 g/t Au from surface (MGAD071) (Figure 2). These results extend the width of the high-grade gold shoot, further defining a plunging structure with consistent distribution of high-grade material.
Results from the five new holes on the 3 m x 3 m grid continue to confirm a robust, high-grade gold shoot near-surface. Highlight intercepts include 30.0 m of 4.52 g/t Au (MGAD061), 23.0 m of 5.31 g/t Au (MGAD062), 19.0 m of 4.02 g/t Au (MGAD064), 30.0 m of 3.69 g/t Au (MGAD060) and 17.0 m of 2.94 g/t Au (MGAD063). Several holes, including MGAD060 and MGAD061, returned gold mineralization to the end of the hole at the 30 m auger limit, indicating that the shoot remains open at depth. All current mineralization is hosted in saprolite; the bedrock beneath the shoot has not yet been tested by diamond drilling. On the east of Maria Geralda, an anomaly with similar widths and grades to the shoot defined in the deep auger program was identified in a historical high-grade channel that returned 12.3 m of 4.52 g/t Au. The location and distribution of grade suggest the presence of a second, vertically stacked mineralized gold shoot within the broader northwest-oriented structure. The Company plans to follow up with an additional deep auger program to test mineralization east of the existing auger grid, near the historical high-grade channel, and to begin diamond drilling to test the shoot into bedrock (Figure 2).
Antino West
The Antino West discovery, announced in June 2026, is located approximately 1.2 kilometres west of Upper Antino, where discovery hole FR217 returned 53.1 m of 1.21 g/t Au from surface. Gold mineralization is associated with quartz-carbonate veining, pervasive sericite alteration and locally up to 10% sulphide within steeply northwest-trending shears developed along the mapped contact between two volcanic units. Follow-up drilling has continued along strike, with hole FR251 - collared approximately 50 m from the discovery hole - intersecting two shear zones: a 35-metre-wide zone with visible gold from 86.0 m, and a separate 11-metre-wide zone from 183.0 m (Figure 3). Assays are pending, and additional follow-up drilling is planned to test the extent of the mineralized system.
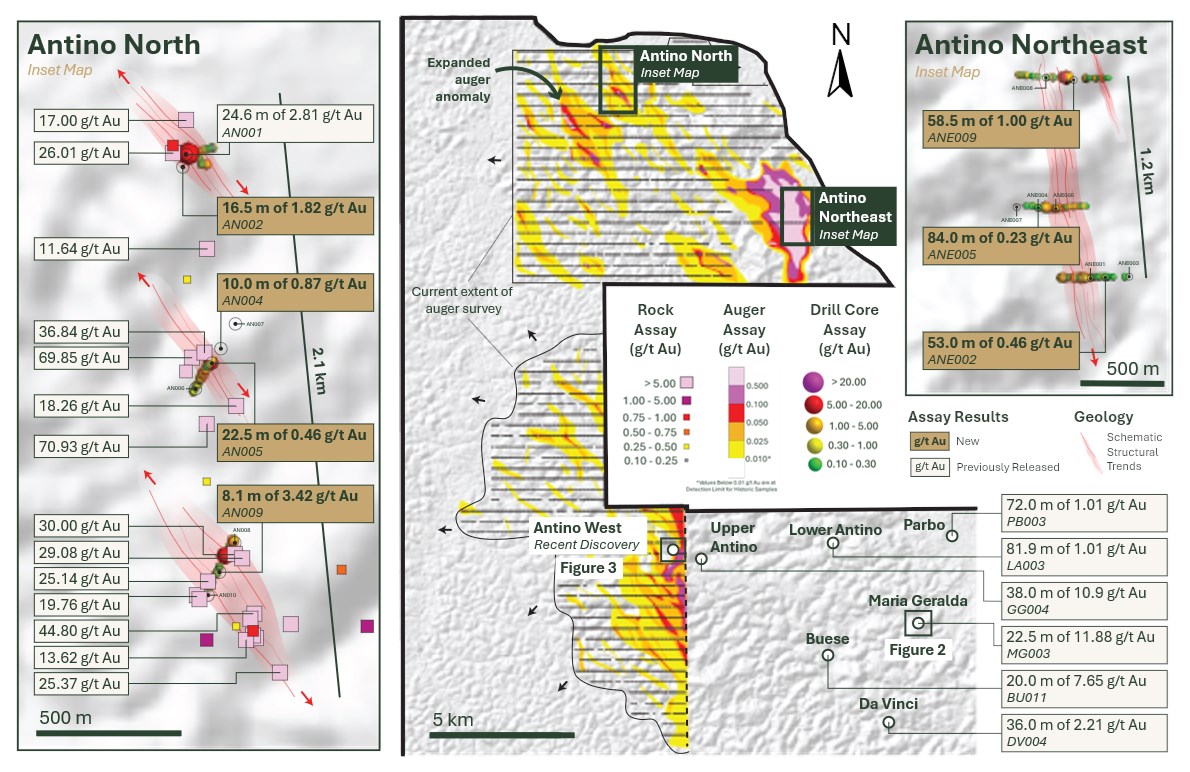
Figure 1: Antino North and Antino Northeast Plan Map
To view an enhanced version of this graphic, please visit:
https://images.newsfilecorp.com/files/7574/305207_85eb4772d470f9c8_002full.jpg
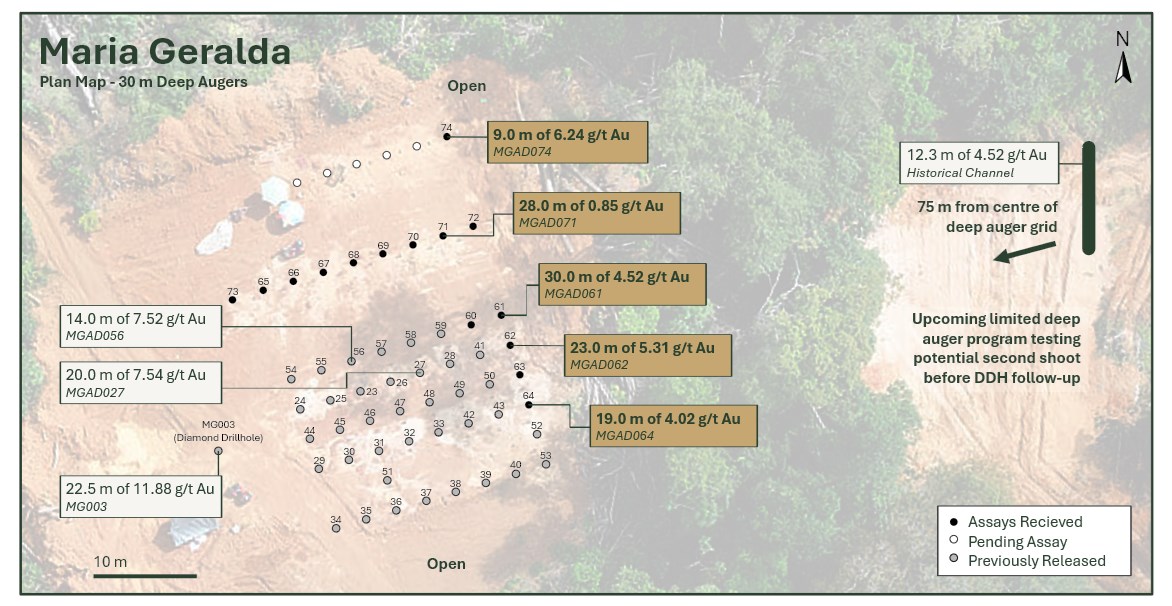
Figure 2: Maria Geralda Plan Map
To view an enhanced version of this graphic, please visit:
https://images.newsfilecorp.com/files/7574/305207_85eb4772d470f9c8_003full.jpg
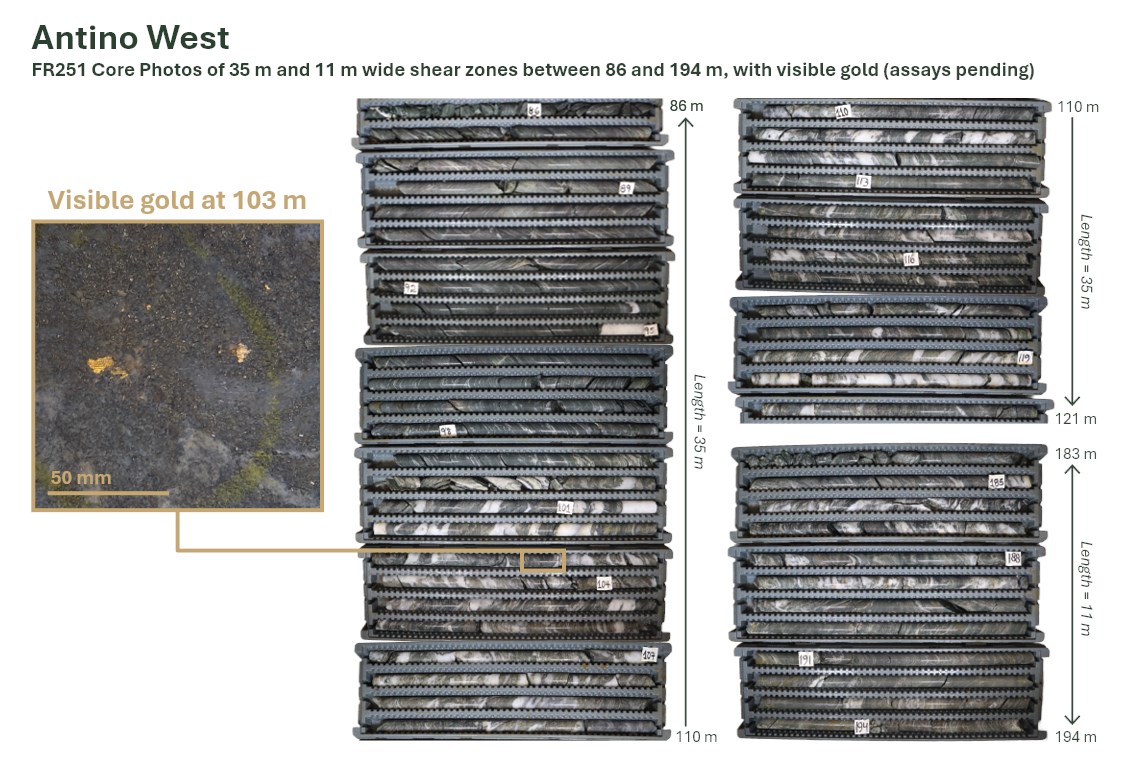
Figure 3: Antino West Core Photos
Note: visible gold identified in core is a visual observation only and is not indicative of gold grade; assay results are pending.
To view an enhanced version of this graphic, please visit:
https://images.newsfilecorp.com/files/7574/305207_85eb4772d470f9c8_005full.jpg
Table 1: Antino Assay Results
| Hole ID | From (m) | To (m) | Interval (m) | Au (g/t) |
| Antino Northeast Drill Holes* | ||||
| ANE009 | 8.10 | 12.60 | 4.50 | 1.41 |
| and** | 18.60 | 77.10 | 58.50 | 1.00 |
| incl | 18.60 | 36.60 | 18.00 | 1.59 |
| incl | 42.60 | 77.10 | 34.50 | 0.85 |
| and | 165.00 | 169.00 | 4.00 | 1.31 |
| ANE008 | 252.00 | 270.00 | 18.00 | 0.22 |
| ANE007 | NSA | |||
| ANE006 | NSA | |||
| ANE005 | 206.00 | 290.00 | 84.00 | 0.23 |
| ANE004 | 185.00 | 213.00 | 28.00 | 0.23 |
| and | 224.00 | 230.00 | 6.00 | 0.83 |
| ANE003 | NSA | |||
| ANE002 | 126.00 | 142.00 | 16.00 | 0.30 |
| and | 149.00 | 202.00 | 53.00 | 0.46 |
| incl | 189.00 | 197.00 | 8.00 | 2.29 |
| and | 217.00 | 221.00 | 4.00 | 1.28 |
| and | 252.00 | 267.00 | 15.00 | 0.36 |
| ANE001 | 24.60 | 57.60 | 33.00 | 0.22 |
| and | 92.10 | 102.60 | 10.50 | 0.57 |
| and | 175.00 | 195.00 | 20.00 | 0.54 |
| incl | 191.00 | 193.00 | 2.00 | 2.84 |
| Antino North Drill Holes* | ||||
| AN010 | NSA | |||
| AN009 | 0.00 | 8.10 | 8.10 | 3.42 |
| AN006-AN008 | NSA | |||
| AN005 | 32.10 | 54.60 | 22.50 | 0.46 |
| and | 81.60 | 84.60 | 3.00 | 1.24 |
| AN004 | 209.00 | 219.00 | 10.00 | 0.87 |
| incl | 212.00 | 214.00 | 2.00 | 3.48 |
| AN003 | NSA | |||
| AN002 | 8.10 | 24.60 | 16.50 | 1.82 |
| incl | 21.60 | 24.60 | 3.00 | 6.38 |
| and | 33.60 | 38.10 | 4.50 | 0.77 |
| and | 72.00 | 96.00 | 24.00 | 0.27 |
| incl | 78.00 | 83.00 | 5.00 | 0.97 |
| Maria Geralda Deep Augers*** | ||||
| MGAD074 | 0.00 | 9.00 | 9.00 | 6.24 |
| MGAD073 | 0.00 | 13.00 | 13.00 | 0.24 |
| MGAD072 | 0.00 | 19.00 | 19.00 | 0.47 |
| MGAD071 | 0.00 | 28.0 | 28.00 | 0.85 |
| MGAD070 | 0.00 | 8.0 | 8.00 | 0.40 |
| MGAD069 | 0.00 | 24.0 | 24.00 | 0.23 |
| MGAD068 | 0.00 | 11.0 | 11.00 | 0.83 |
| MGAD067 | 0.00 | 14.0 | 14.00 | 0.35 |
| MGAD066 | NSA | |||
| MGAD065 | NSA | |||
| MGAD064 | 11.00 | 30.00 | 19.0 | 4.02 |
| MGAD063 | 0.00 | 8.00 | 8.0 | 0.53 |
| and | 13.00 | 30.00 | 17.0 | 2.94 |
| MGAD062 | 0.00 | 23.00 | 23.0 | 5.31 |
| MGAD061 | 0.00 | 30.00 | 30.0 | 4.52 |
| MGAD060 | 0.00 | 30.00 | 30.0 | 3.69 |
| *Intervals are down-hole depths. True widths of mineralization are unknown at this time based on currently available results and observations. Interval average grades are calculated with un-capped gold assays, as insufficient drilling has been completed to determine capping levels for higher-grade gold intercepts. Widths are calculated using a 0.10 g/t gold cut-off grade with <5.0 m of internal dilution of zero grade (unless otherwise specified), and a minimum composite length of 2.0 m. Intervals below 3.0 gram-metres are omitted. NSA means No Significant Assays. **Interval includes 6.0 m of dilution from 36.60 m to 42.60 m ***Intervals are vertical down-hole depths in saprolite. True widths are approximately 80-85%. Intercepts are un-capped and calculated using a 0.10 g/t Au cut-off grade with <5.0 m of internal dilution of zero grade, and a minimum composite length of 2.0 m. Intervals below 3.0 gram-metres are omitted. NSA means No Significant Assays. Deep auger grid centred at UTM Zone 21N 825750 E, 398240 N. | ||||
Table 2: Drill Hole and Deep Auger Locations
| Hole ID | Easting (m) | Northing (m) | Elevation (m) | Azimuth (°) | Dip (°) | Depth (m) |
| Antino Northeast Drill Holes | ||||||
| ANE009 | 820607.33 | 414840.33 | 170.04 | 270.00 | -50.00 | 200.00 |
| ANE008 | 820476.50 | 414838.00 | 133.04 | 270.00 | -50.00 | 270.00 |
| ANE007 | 820275.00 | 414080.50 | 125.46 | 90.00 | -50.00 | 199.80 |
| ANE006 | 820527.00 | 414068.00 | 126.49 | 90.00 | -50.00 | 284.00 |
| ANE005 | 820400.00 | 414070.50 | 125.82 | 90.00 | -70.00 | 351.04 |
| ANE004 | 820400.00 | 414070.50 | 125.82 | 90.00 | -50.00 | 278.02 |
| ANE003 | 820936.00 | 413658.00 | 133.61 | 270.00 | -50.00 | 245.00 |
| ANE002 | 820818.50 | 413660.50 | 143.72 | 270.00 | -50.00 | 269.01 |
| ANE001 | 820706.00 | 413651.00 | 165.79 | 270.00 | -50.00 | 254.00 |
| Antino North Drill Holes | ||||||
| AN010 | 813886.67 | 418670.50 | 155.80 | 210.00 | -55.00 | 251.00 |
| AN009 | 813958.00 | 418793.00 | 145.52 | 210.00 | -55.00 | 305.00 |
| AN008 | 813997.00 | 418864.50 | 146.17 | 210.00 | -55.00 | 362.10 |
| AN007 | 813990.00 | 419593.50 | 163.79 | 210.00 | -55.00 | 242.14 |
| AN006 | 813829.33 | 419327.33 | 140.28 | 210.00 | -55.00 | 227.00 |
| AN005 | 813896.00 | 419444.67 | 160.92 | 210.00 | -55.00 | 305.00 |
| AN004 | 813939.00 | 419512.00 | 170.42 | 210.00 | -70.00 | 398.02 |
| AN003 | 813787.50 | 420132.50 | 163.38 | 90.00 | -55.00 | 263.00 |
| AN002 | 813831.00 | 420169.00 | 149.52 | 80.00 | -70.00 | 311.07 |
| Maria Geralda Deep Augers | ||||||
| MGAD074 | 825751.42 | 398255.89 | 160.78 | - | -90.00 | 30.00 |
| MGAD073 | 825731.95 | 398239.22 | 161.56 | - | -90.00 | 30.00 |
| MGAD072 | 825754.50 | 398247.43 | 159.40 | - | -90.00 | 30.00 |
| MGAD071 | 825751.69 | 398246.40 | 160.20 | - | -90.00 | 30.00 |
| MGAD070 | 825748.87 | 398245.37 | 160.58 | - | -90.00 | 30.00 |
| MGAD069 | 825746.05 | 398244.35 | 160.95 | - | -90.00 | 30.00 |
| MGAD068 | 825743.23 | 398243.32 | 161.58 | - | -90.00 | 30.00 |
| MGAD067 | 825740.41 | 398242.30 | 162.28 | - | -90.00 | 30.00 |
| MGAD066 | 825737.59 | 398241.27 | 162.45 | - | -90.00 | 30.00 |
| MGAD065 | 825734.52 | 398239.98 | 161.73 | - | -90.00 | 30.00 |
| MGAD064 | 825758.95 | 398227.87 | 157.76 | - | -90.00 | 30.00 |
| MGAD063 | 825758.24 | 398231.09 | 157.91 | - | -90.00 | 30.00 |
| MGAD062 | 825757.57 | 398234.22 | 158.04 | - | -90.00 | 23.00 |
| MGAD061 | 825756.96 | 398237.10 | 158.23 | - | -90.00 | 30.00 |
| MGAD060 | 825753.75 | 398236.01 | 158.45 | - | -90.00 | 30.00 |
| Antino West Drill Holes | ||||||
| FR251 | 815974.50 | 400523.00 | 292.69 | 260.0 | -50.00 | 275.00 |
| Coordinates are reported in WGS 84 / UTM Zone 21N | ||||||
About Founders Metals Inc.
Founders Metals Inc. is a Canadian gold exploration company building a district-scale gold camp in southeastern Suriname. The Company controls a 102,360-hectare contiguous land package in the Guiana Shield - the largest uninterrupted package of highly prospective greenstone belt geology in the region. Founders is executing one of the most active exploration programs in the global junior gold sector and is backed by a strategic partnership with Gold Fields Limited. The Company is committed to responsible exploration, strong community engagement, and disciplined capital allocation as it advances Suriname's next major gold camp.
ON BEHALF OF THE BOARD OF DIRECTORS,
Per: "Colin Padget"
Colin Padget
President, Chief Executive Officer, and Director
Contact Information
Katie MacKenzie, Vice President, Corporate Development
Tel: +1 604 712 1790 | [email protected]
Quality Assurance and Control
Samples were analyzed at FILAB Suriname, a Bureau Veritas Certified Laboratory in Paramaribo, Suriname (a commercial certified laboratory under ISO 9001:2015). Samples are crushed to 75% passing 2.35 mm screen, riffle split (700 g) and pulverized to 85% passing 88 µm. Samples were analyzed using a 50 g fire assay (50 g aliquot) with an Atomic Absorption (AA) finish. For samples that return assay values over 5.0 grams per tonne (g/t), another cut was taken from the original pulp and fire assayed with a gravimetric finish. Founders Metals inserts blanks and certified reference standards in the sample sequence for quality control. External QA-QC checks are performed at ALS Global Laboratories (Geochemistry Division) in Lima, Peru (an ISO/IEC 17025:2017 accredited facility). A secure chain of custody is maintained in transporting and storing of all samples. Drill intervals with visible gold are assayed using metallic screening. Rock chip samples from outcrop/bedrock are selective by nature and may not be representative of the mineralization hosted on the project. The channel sample result of 12.3 m of 4.52 g/t Au referred to in this news release is historical in nature. A qualified person has not completed sufficient work to verify this historical result, and it should not be relied upon. The Company considers the result relevant as it demonstrates the potential for gold mineralization east of the current deep auger grid and is using it to guide follow-up exploration. Deep auger samples were collected at 1 m intervals from vertical auger holes drilled to 30 m depth in saprolite using a 5-inch diameter Little Beaver deep auger; each interval was homogenized and split, with one half retained for geological logging and the other half submitted to the laboratory.
Qualified Persons
The technical content of this news release has been reviewed and approved by Michael Dufresne, M.Sc., P.Geol., P.Geo., an independent qualified person as defined by National Instrument 43-101.
Cautionary Statement Regarding Forward-Looking Information
This press release contains "forward-looking information" within the meaning of applicable Canadian securities legislation, including statements regarding long term value creation and Company's prospects. Forward-looking information can generally be identified by words such as "plans", "expects", "is expected", "budget", "scheduled", "estimates", "forecasts", "intends", "anticipates", "believes", or variations indicating that certain actions, events or results "may", "could", "would", "might" or "will" occur or be achieved.
Forward-looking statements are based on management's current expectations and reasonable assumptions but are subject to business, market, and economic risks, uncertainties, and contingencies that may cause actual results to differ materially from those expressed or implied, including: general business and economic uncertainties; exploration results; mining industry risks; and other factors described in the Company's most recent annual management discussion and analysis. Although the Company has attempted to identify important factors that could cause actual results to differ materially, other factors may cause results not to be as anticipated. There can be no assurance that forward-looking information will prove accurate, as actual results and future events could differ materially from those anticipated. Accordingly, readers should not place undue reliance on forward-looking information. The Company does not undertake to update any forward-looking information except in accordance with applicable securities laws. Neither TSX Venture Exchange nor its Regulation Services Provider (as that term is defined in policies of the TSX Venture Exchange) accepts responsibility for the adequacy or accuracy of this release.
All material information on Founders Metals can be found at www.sedarplus.ca.
![]()
To view the source version of this press release, please visit https://www.newsfilecorp.com/release/305207